 ShoosOn
 Introducing ShoosOn heatmaps
ShoosOn heatmaps let you switch between frequency, pace, and heart rate to see your running from three different angles.
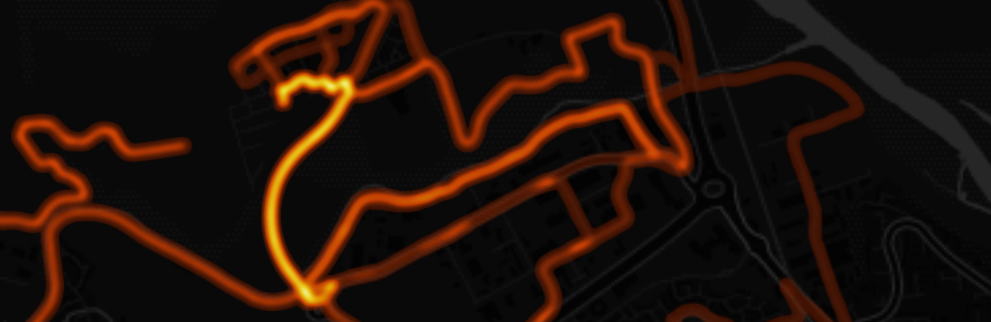
Every familiar route tells more than one story.
There is the road you run again and again. The stretch where your pace lifts without thinking. The hill where effort spikes even when speed drops.
Most heatmaps only show the first story. ShoosOn now shows three.
ShoosOn Heatmaps
Switch between three ways of looking at your running history:
- Frequency — The classic heatmap view. Brighter areas are where you’ve run most often.
- Pace — Brighter areas are where you’ve tended to run faster.
- Heart rate — Brighter areas are where your effort has been highest.
Frequency — brighter areas are where you run more often.

Pace — brighter areas are where you run faster.
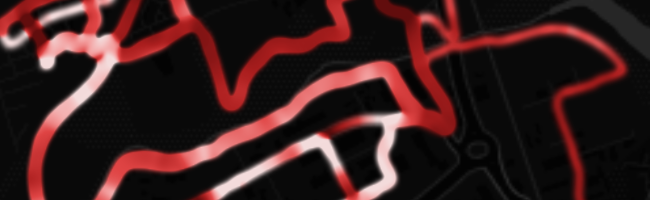
Heart rate — brighter areas are where effort is highest.
Switching between them is instant. The same route can look familiar in one view, revealing in another, and surprising in the third.
Three maps, three different stories
This is what makes the feature more than a pretty picture.
A loop you thought was just your usual route might turn out to be your fastest section in pace view, or the place where your heart rate climbs hardest. A quiet trail you barely notice in frequency view might stand out immediately when you switch layers.
That makes the map useful in a way a frequency-only heatmap cannot. It shows not just where you run, but how your body responds there.
Zoom in on your own patch
Years of running can spread across home routes, holidays, races, and the odd one-off adventure. Sometimes you want the full picture. Sometimes you want the part that matters today.
ShoosOn lets you clip the heatmap to a radius around your saved home location: 5 km, 15 km, 40 km, or All. So you can zoom in on the roads and trails you actually know, instead of a faint blur of everywhere you’ve ever logged a run.
Built with the same privacy approach as before
Heatmaps are useful, but they can also reveal more than you’d want a stranger to see, especially where you live. ShoosOn already trims the first and last 200 m of every route before sharing.
We’ve also added a clearer heads-up: before you share a heatmap image, ShoosOn tells you plainly that dense clusters of activity can still hint at a home area, even with the endpoints trimmed. You can decide whether to share anyway.
It’s a small addition, but it makes the choice explicit rather than assuming a heatmap is automatically anonymous.
Why this matters
A heatmap should tell you something about how you actually run, not just where the lines overlap.
ShoosOn’s heatmaps can now answer questions a classic heatmap cannot:
- Which of my local loops do I actually run fastest?
- Where do I consistently push my heart rate the hardest?
- What routes have I stopped using without noticing?
That’s a map that works for you, not just a nice-looking GPS trail, though it still makes a very good-looking one.
Want early access to ShoosOn?
If you want to try the new heatmap layers while getting free lifetime access as a beta user, join the waitlist: